The photometry of MUSE field UDF01
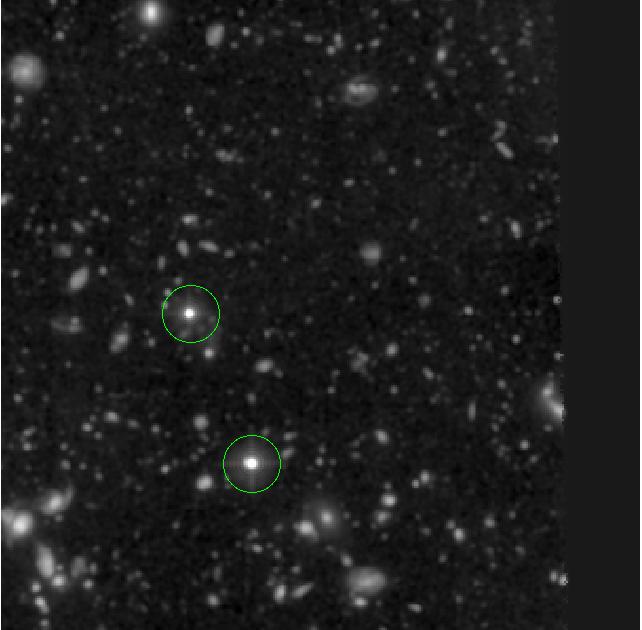
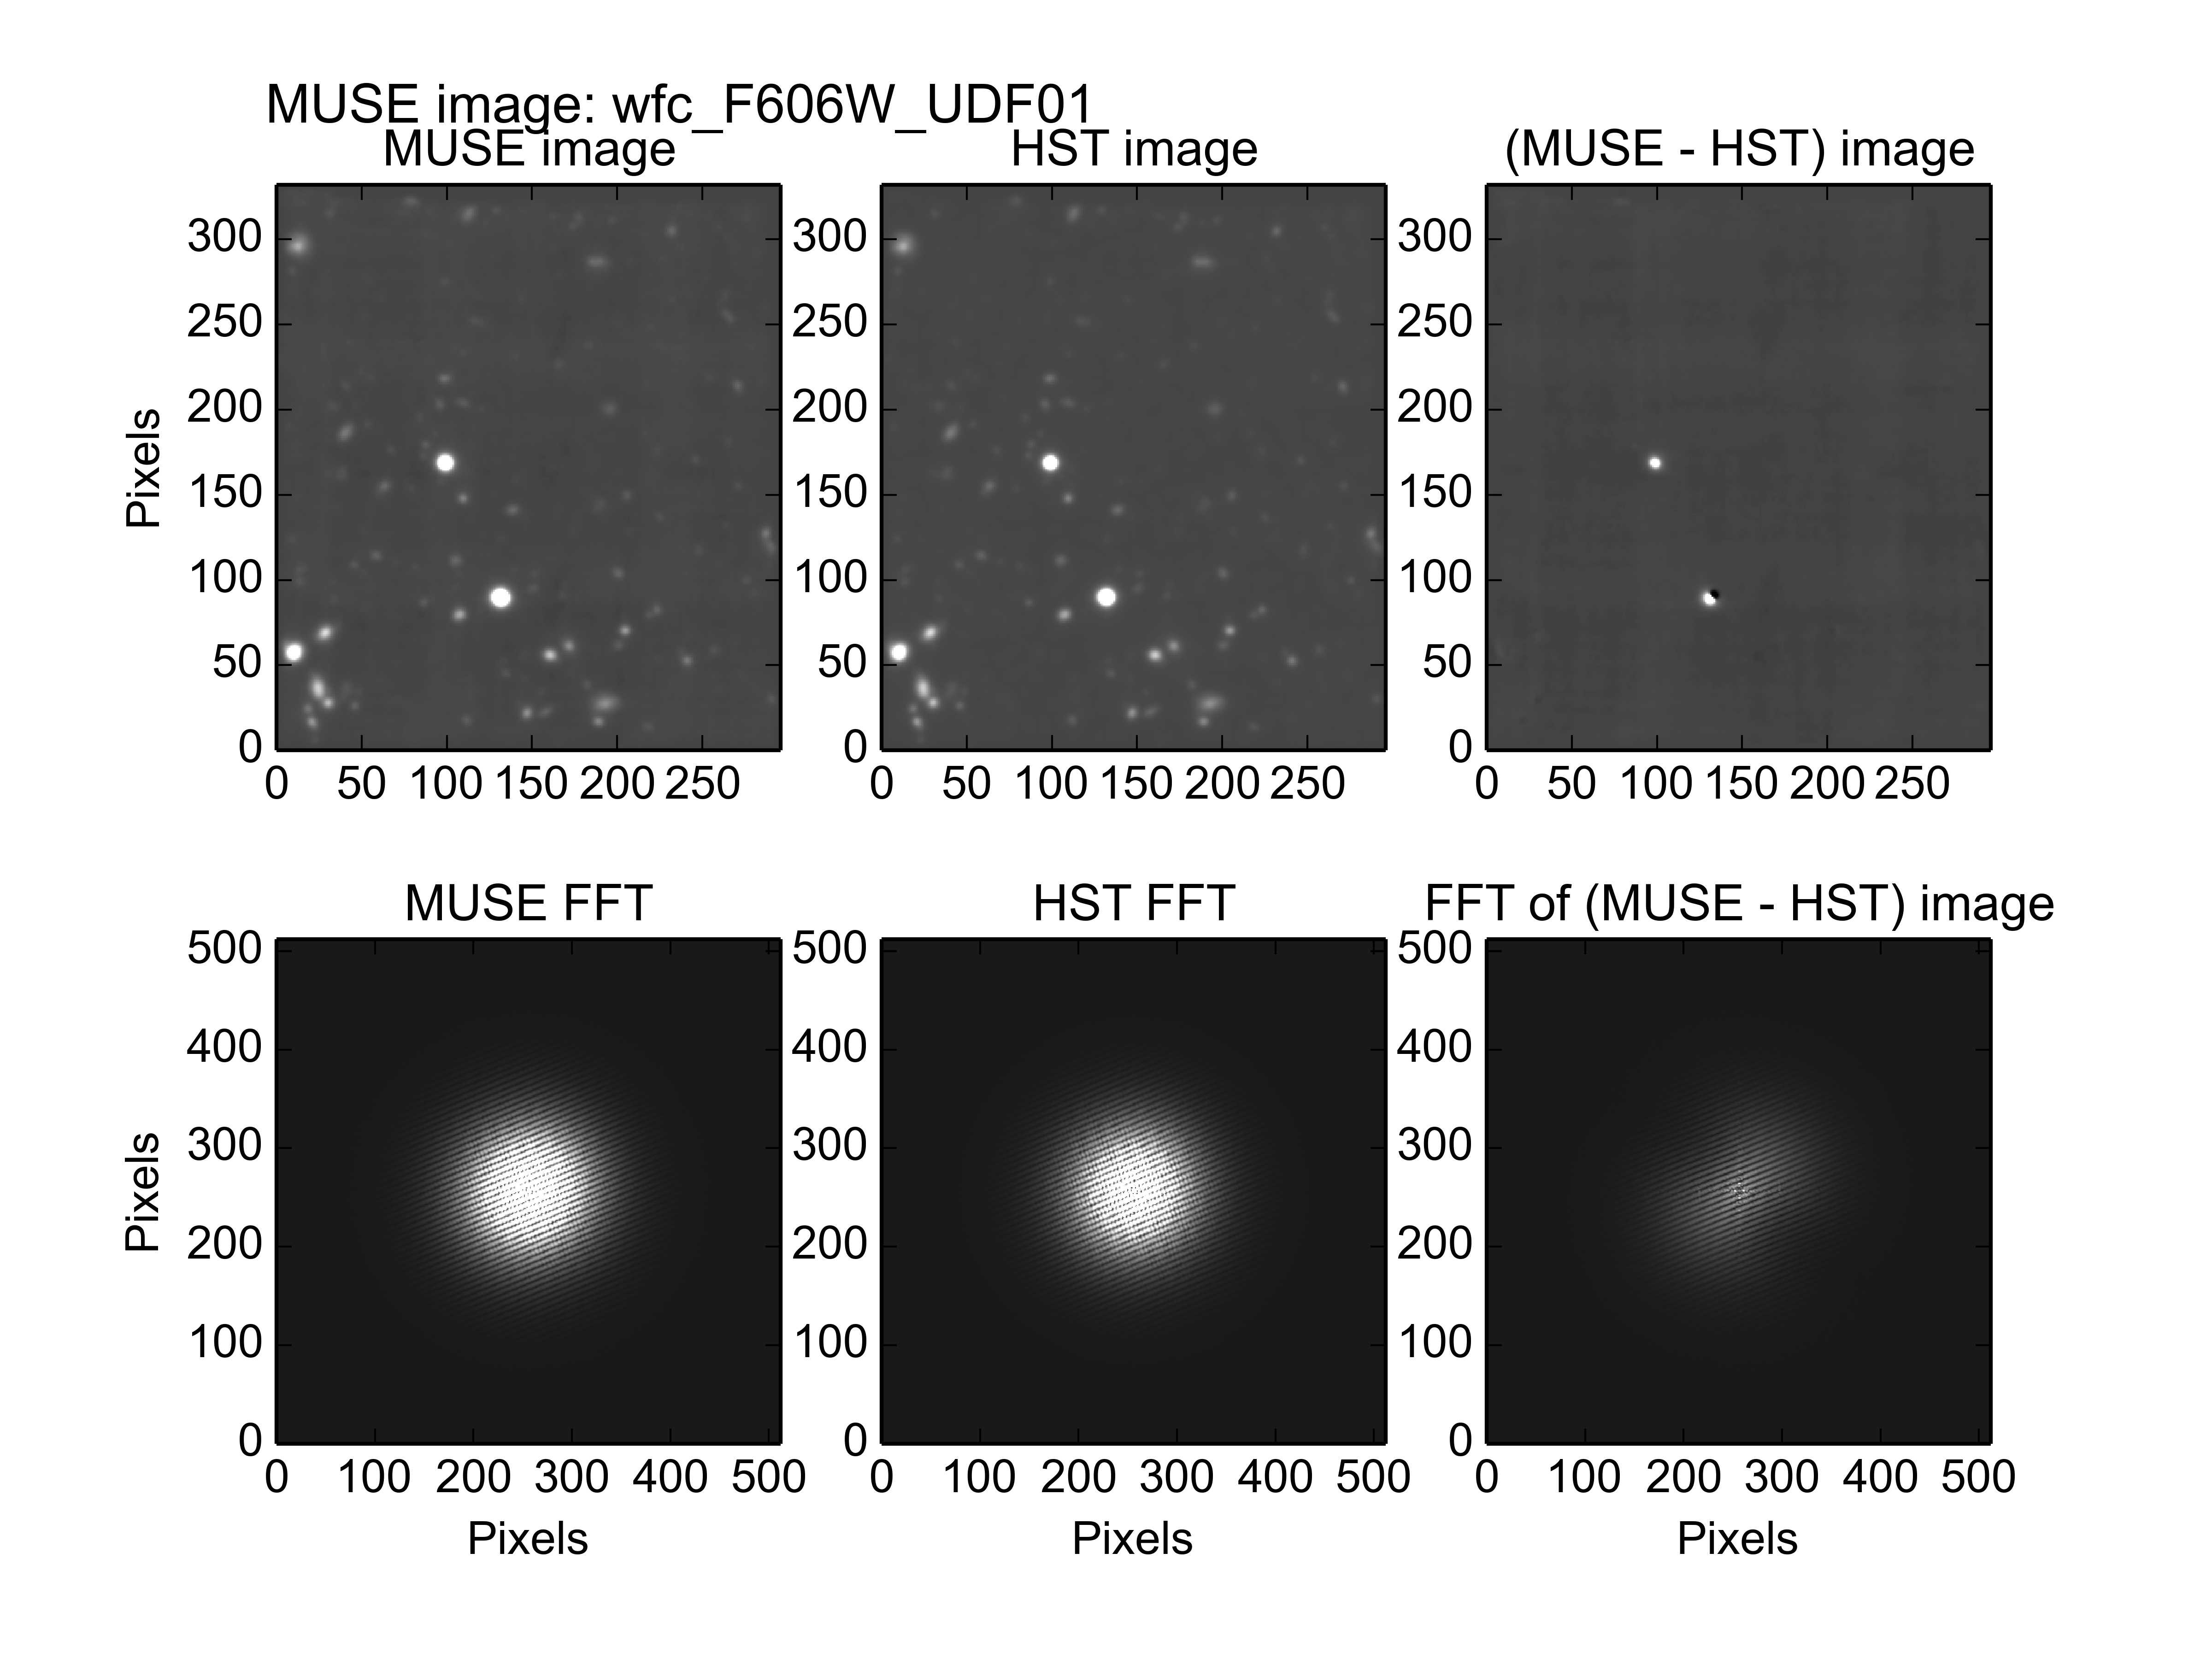
Muse field UDF01 is a 1x1 arc-minute field centered at Right Ascension 03:32:38 and declination -27:45:53, within the Hubble UDF. The HST image of this region, seen through the F606W filter and resampled onto the pixel grid of the MUSE images of UDF01, is shown below.
Problematic issues that affect this field
Fitting the photometric parameters of this field turned out to be more challenging than was initially expected. This was due to two bright point sources, which are circled in the above image.
The first attempt to fit the photometric parameters yielded the following unsatisfactory results for the F606W image:
% fit_photometry hst_F606W_for_UDF01.fits wfc_F606W_UDF01.fits --fix_beta=2.8 --hardcopy jpeg
# MUSE observation ID              Method    Flux    FWHM    beta      Flux  x-offset  y-offset
#                                           scale     (")            offset       (")       (")
#--------------------------------- ------  ------  ------  ------  --------  --------  --------
                   wfc_F606W_UDF01  image  1.1261  0.6557  2.8000   0.05043  -0.03945  -0.04462
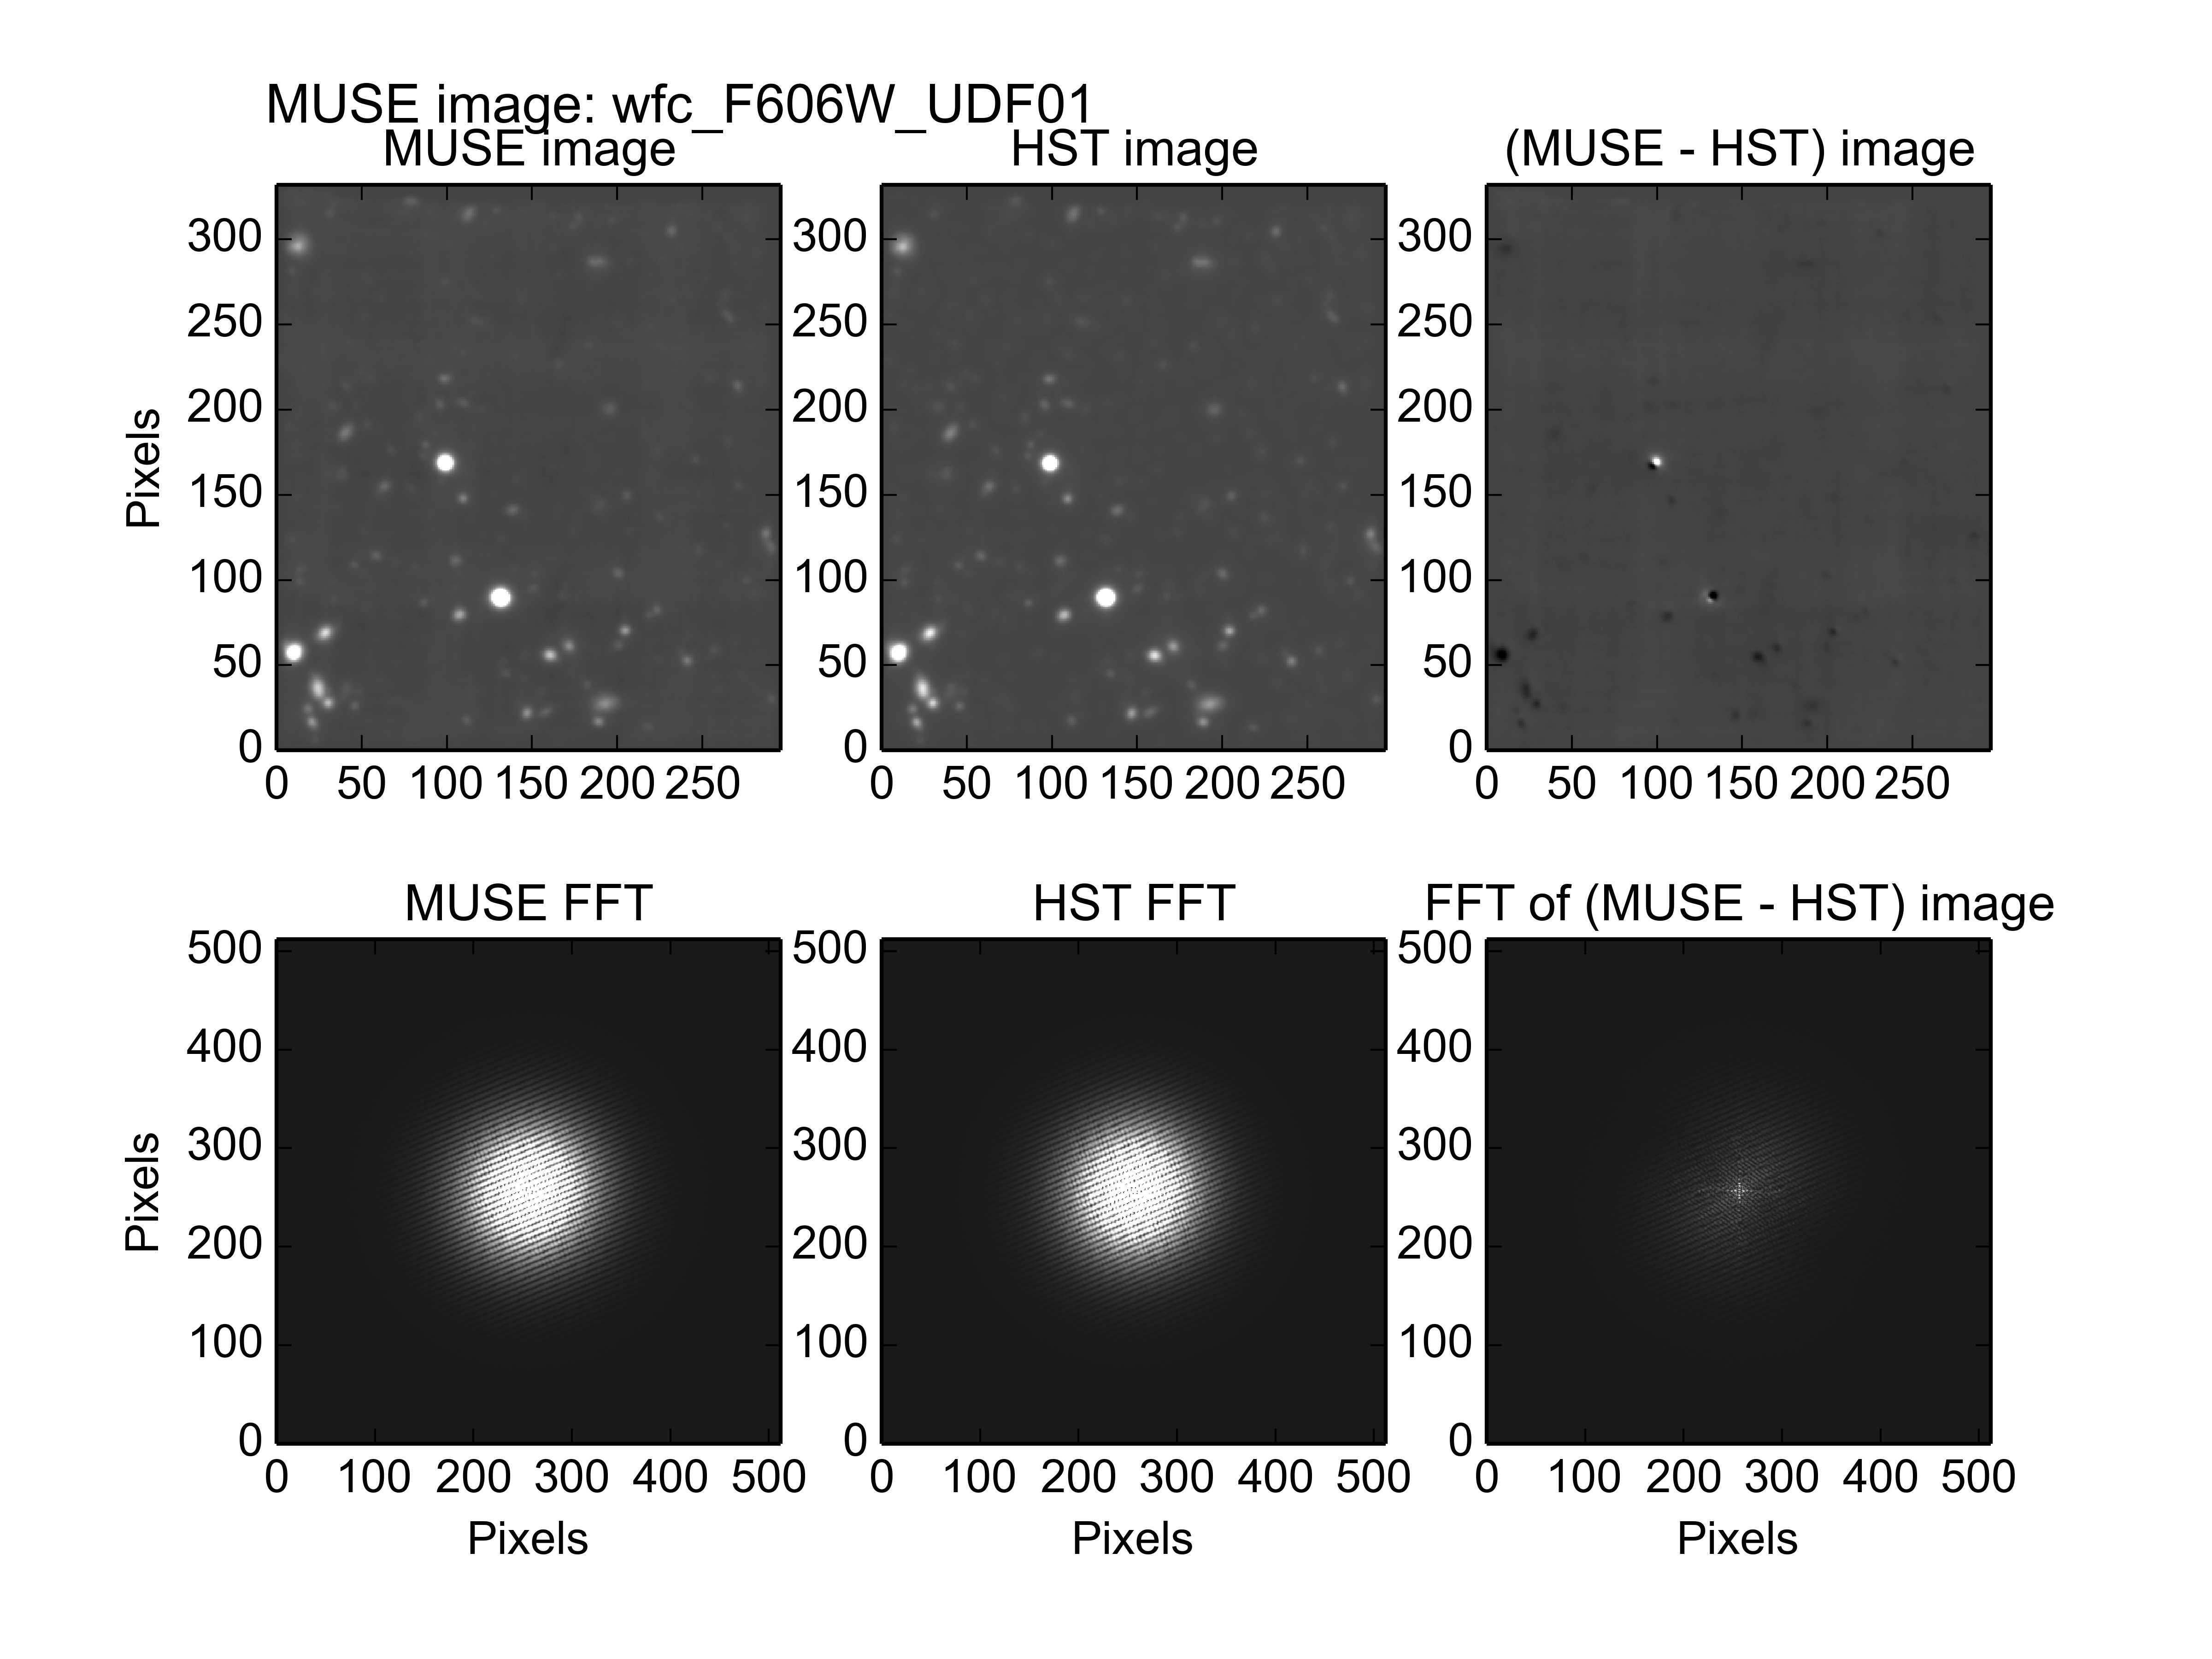
In the residual image, note that the bright point sources appear to be under-subtracted by the HST model of the MUSE image, whereas other sources appear as small black areas that indicate that they were over-subtracted. This implies that the flux scale factor would need to be higher to properly fit the bright point sources, but lower to fit the other sources in the image. This is partly due to one of the point sources having a high proper motion, but mostly because the HST WFC suffered flux loss for faint stars against dark backgrounds, as described in the section on common pitfalls.
Using the
exclude_udf_stars.reg
region file to mask out the two bright point sources, produced the
following fit:
% fit_photometry hst_F606W_for_UDF01.fits wfc_F606W_UDF01.fits --fix_beta=2.8 --hardcopy jpeg --regions exclude_udf_stars.reg
# MUSE observation ID              Method    Flux    FWHM    beta      Flux  x-offset  y-offset
#                                           scale     (")            offset       (")       (")
#--------------------------------- ------  ------  ------  ------  --------  --------  --------
              wfc_F606W_UDF01  image  0.9484  0.6519  2.8000   0.05713   0.01345   0.00617
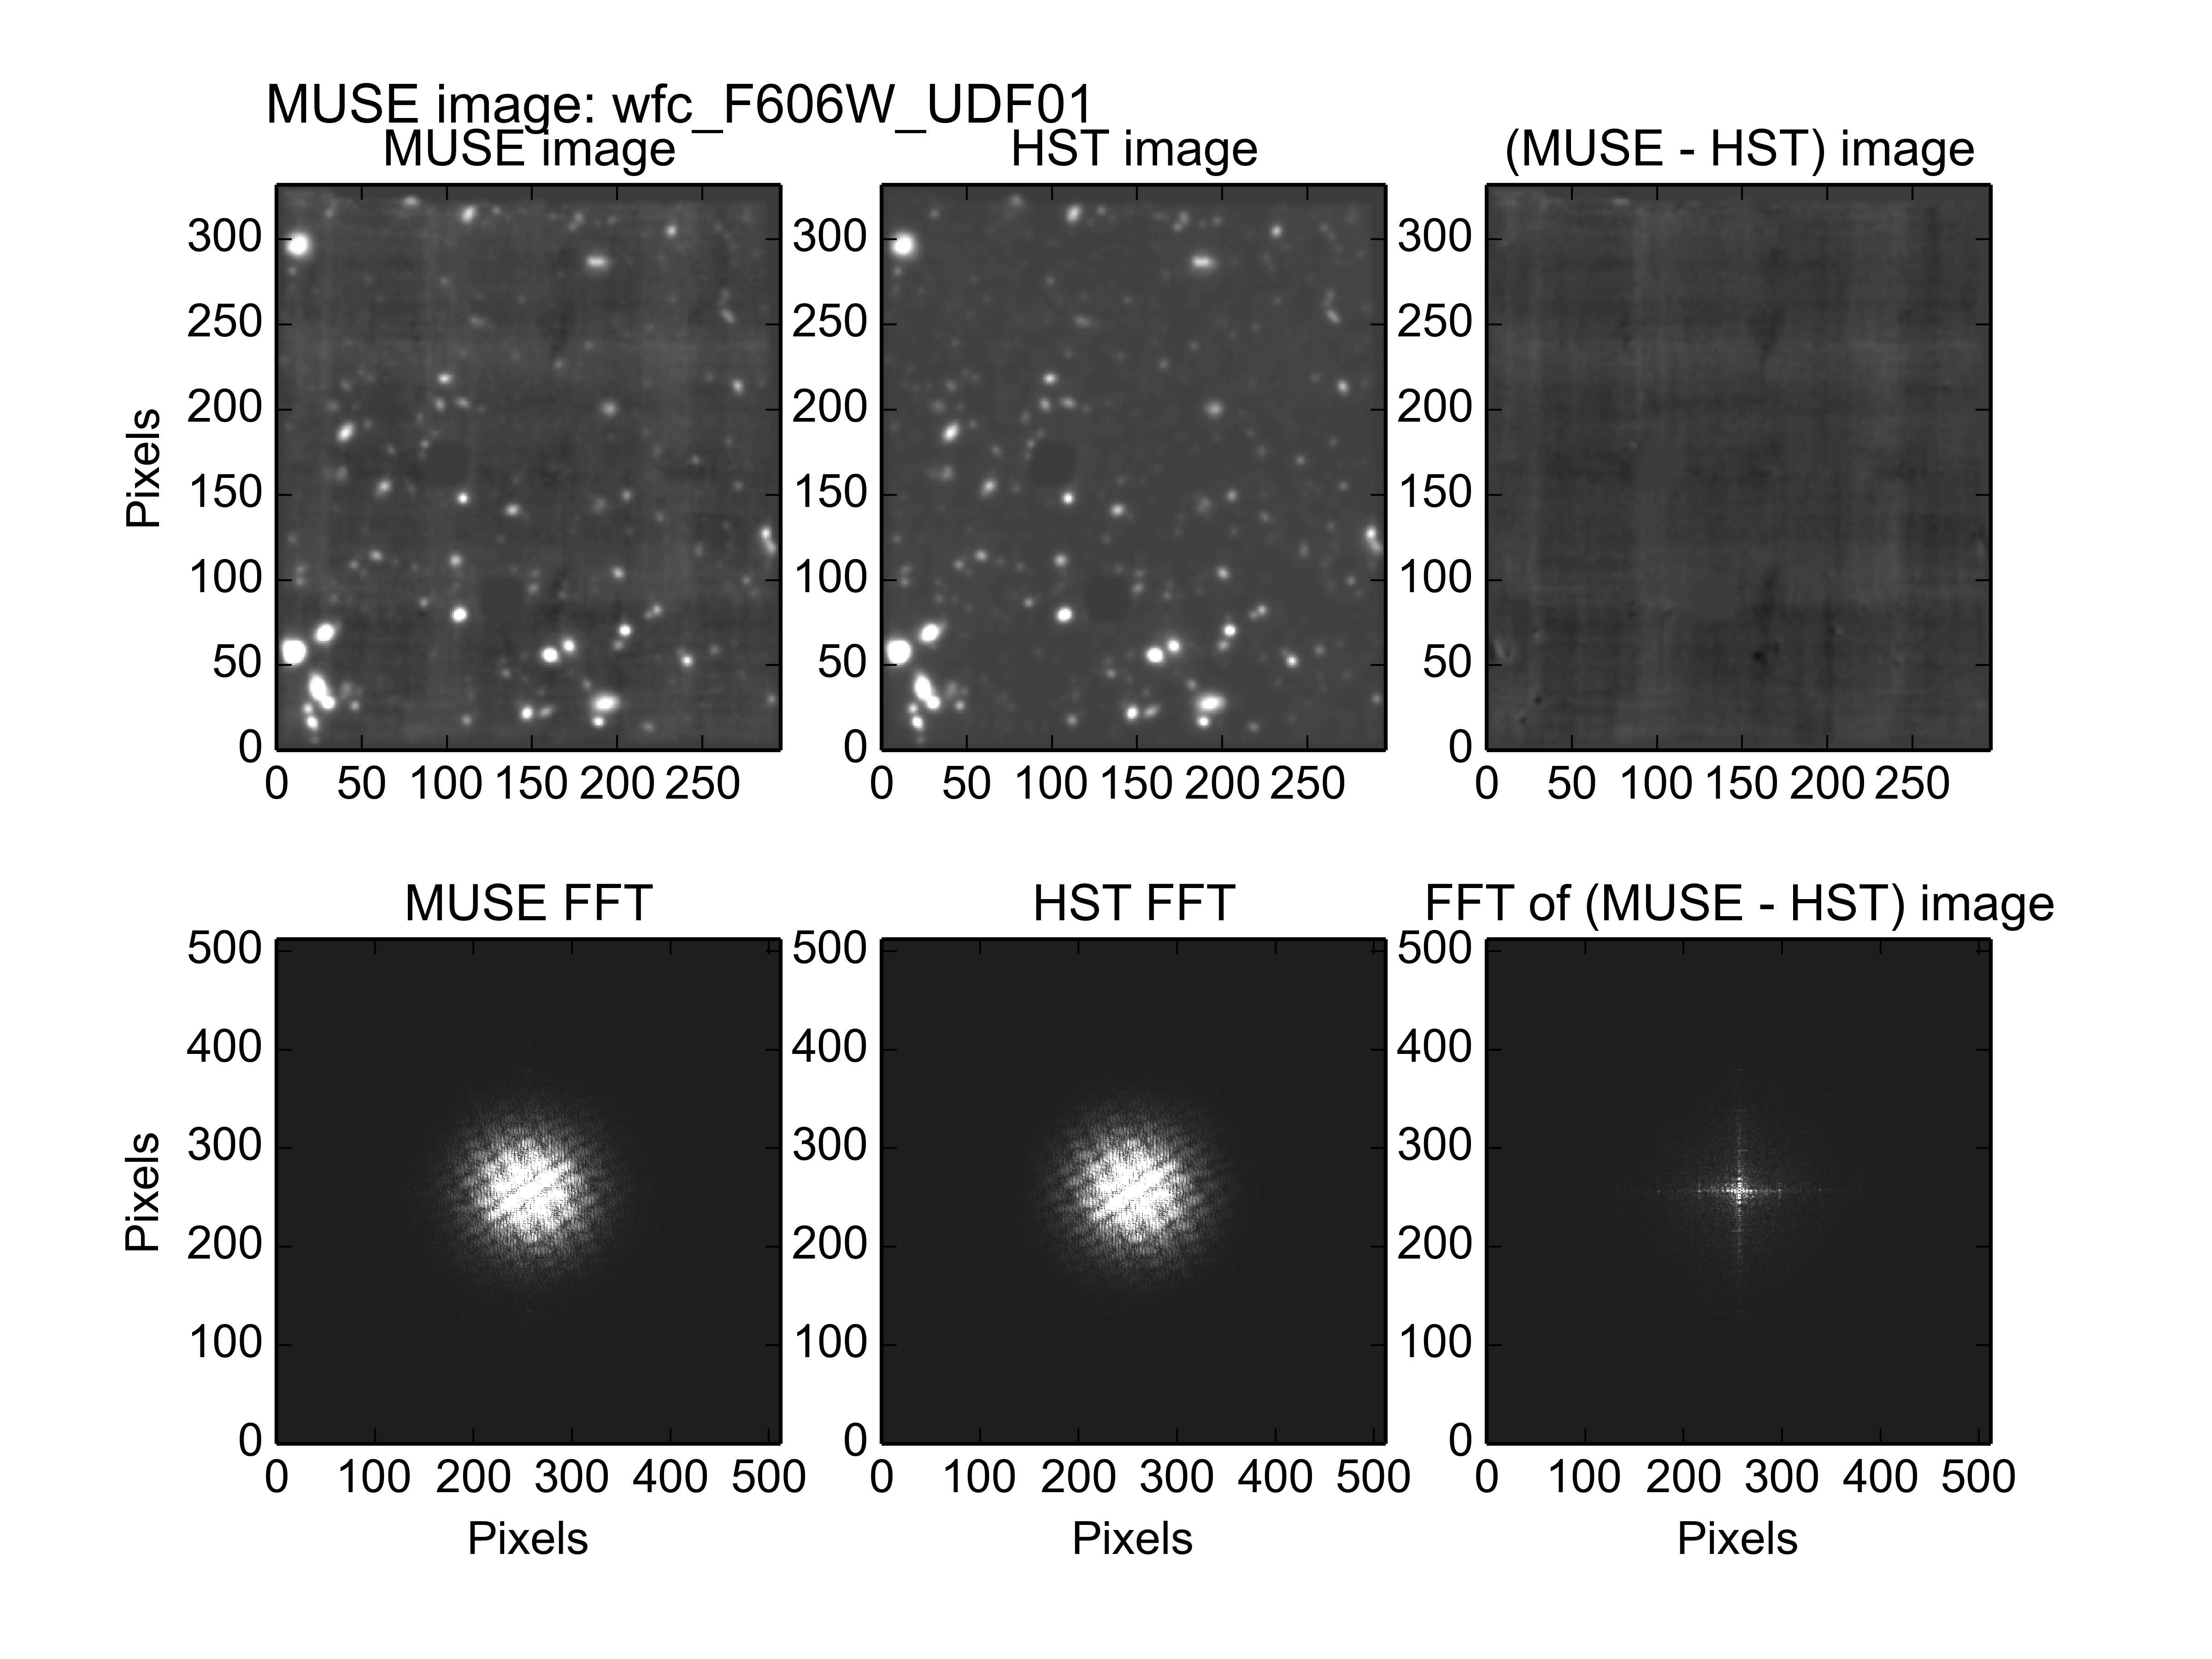
The residual image looks much better now. Note that only the fitted flux scale and X and Y position shifts significantly changed.
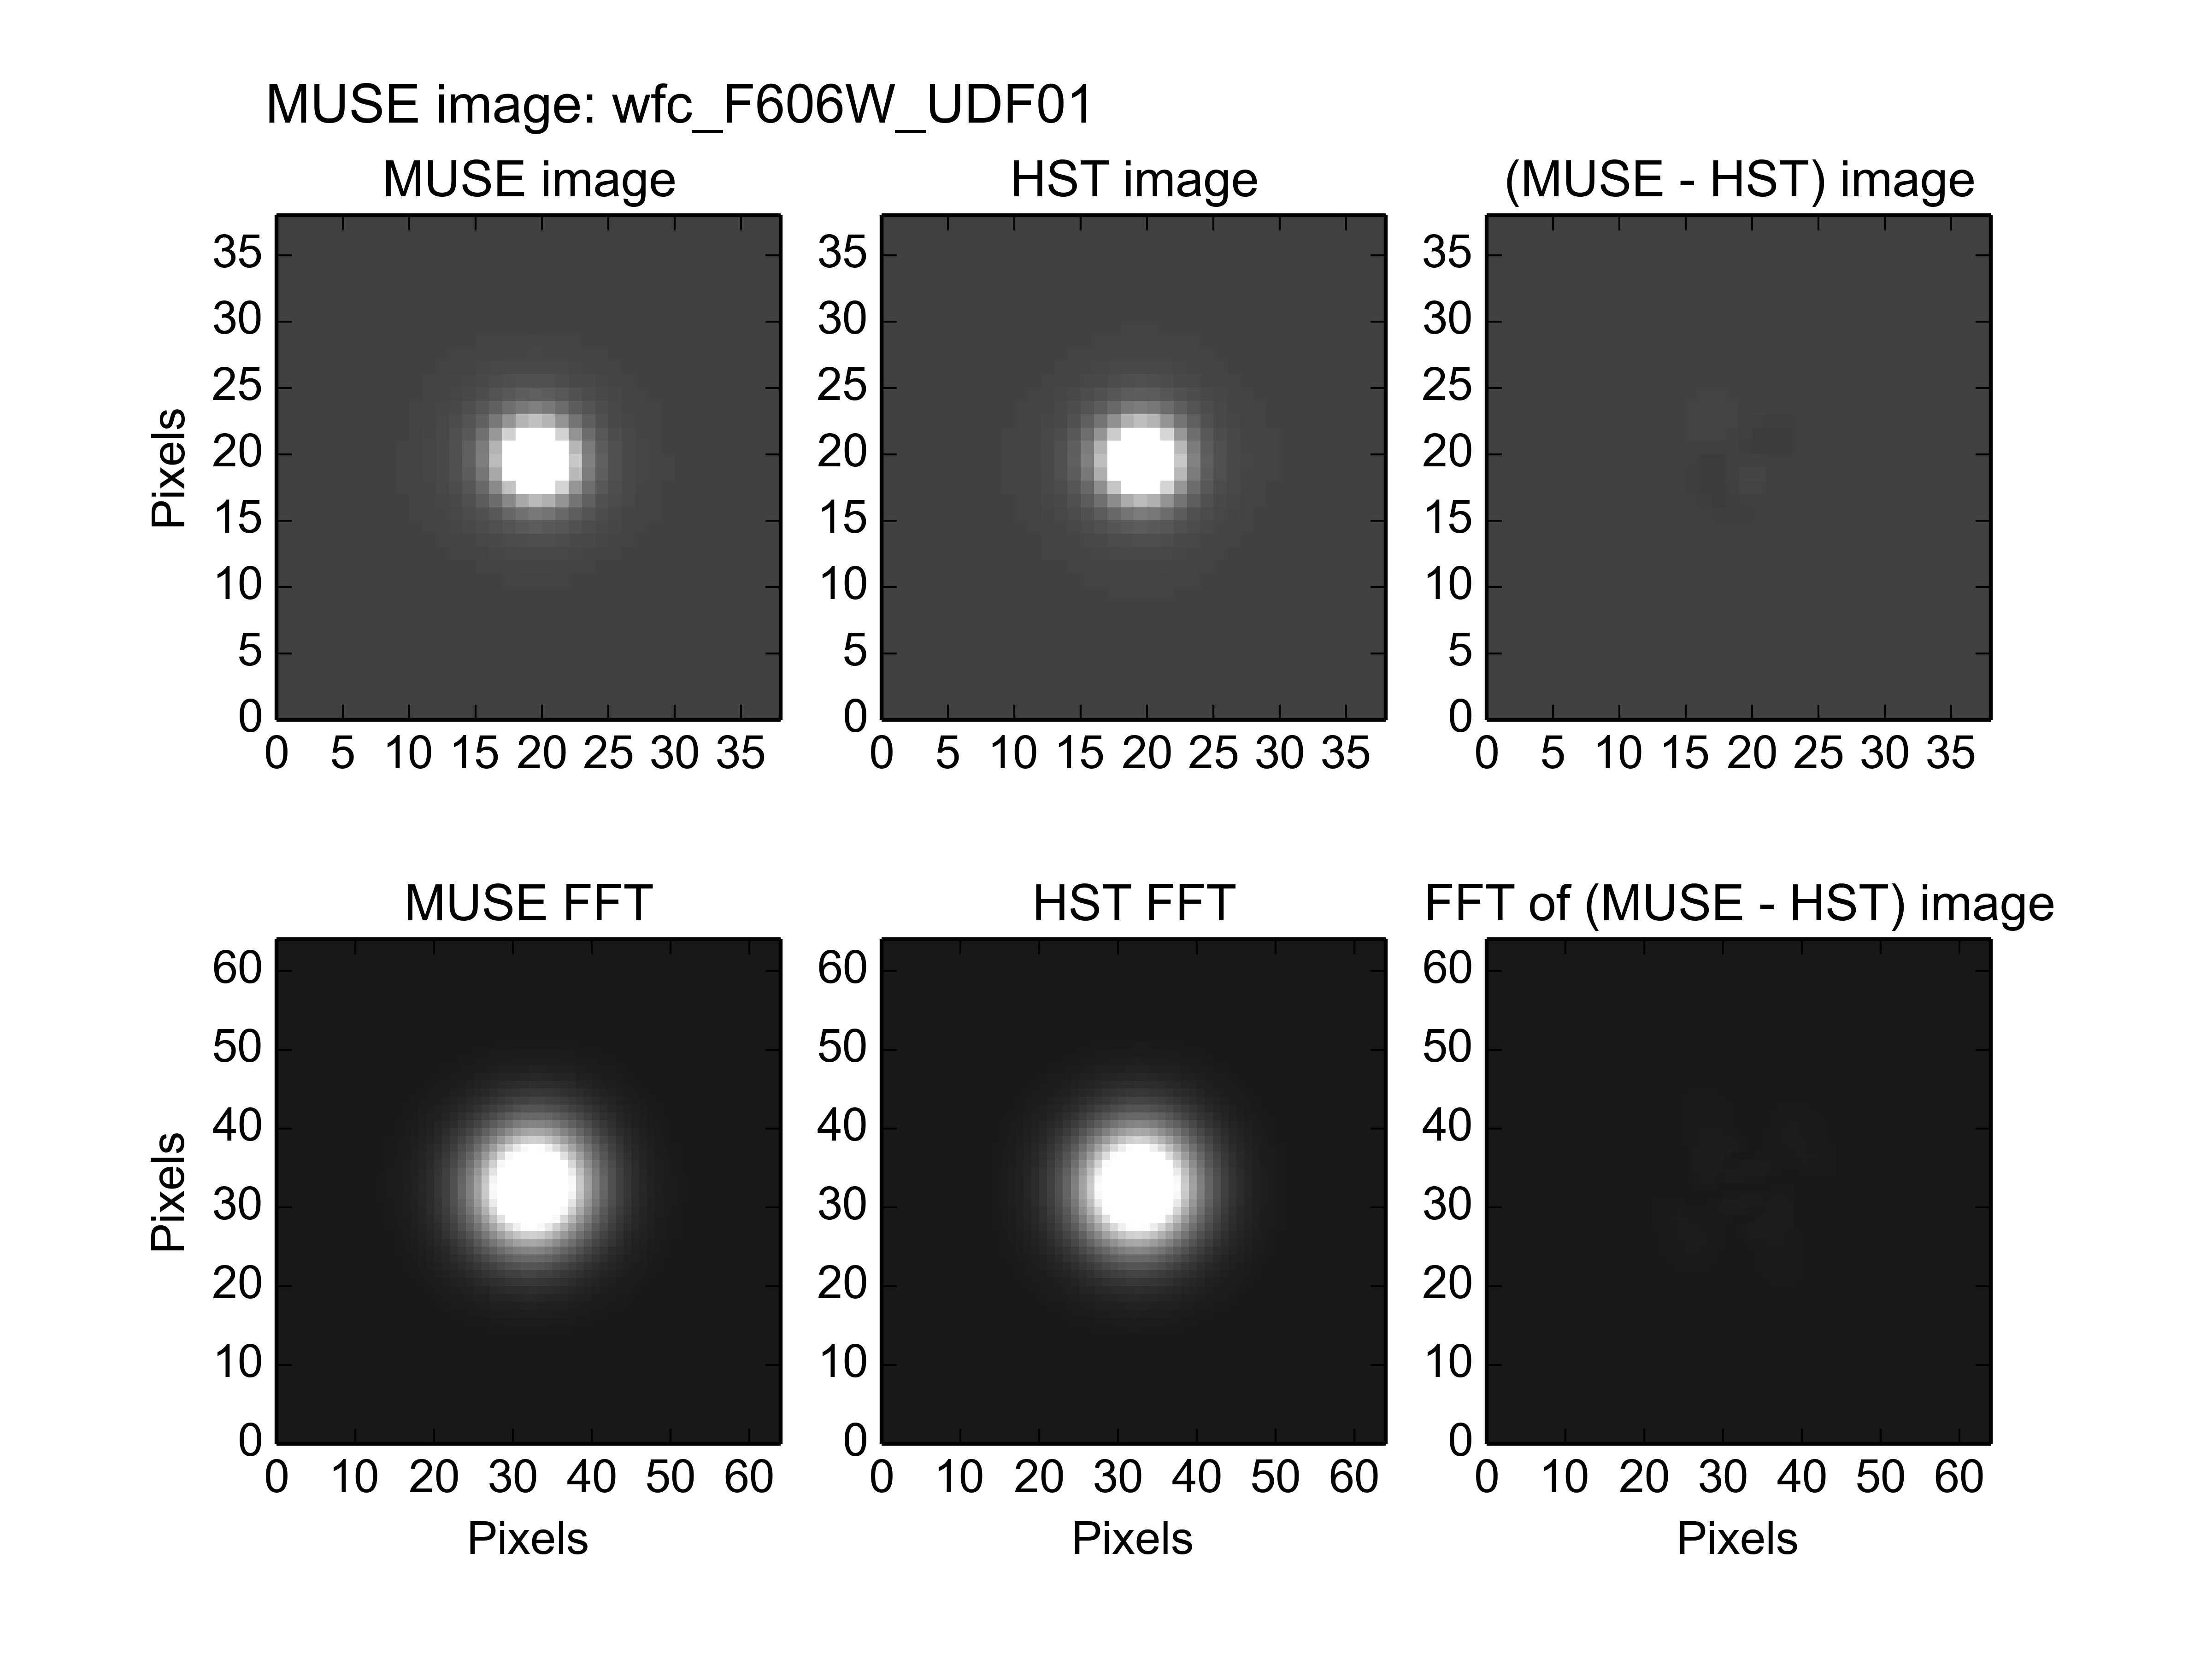
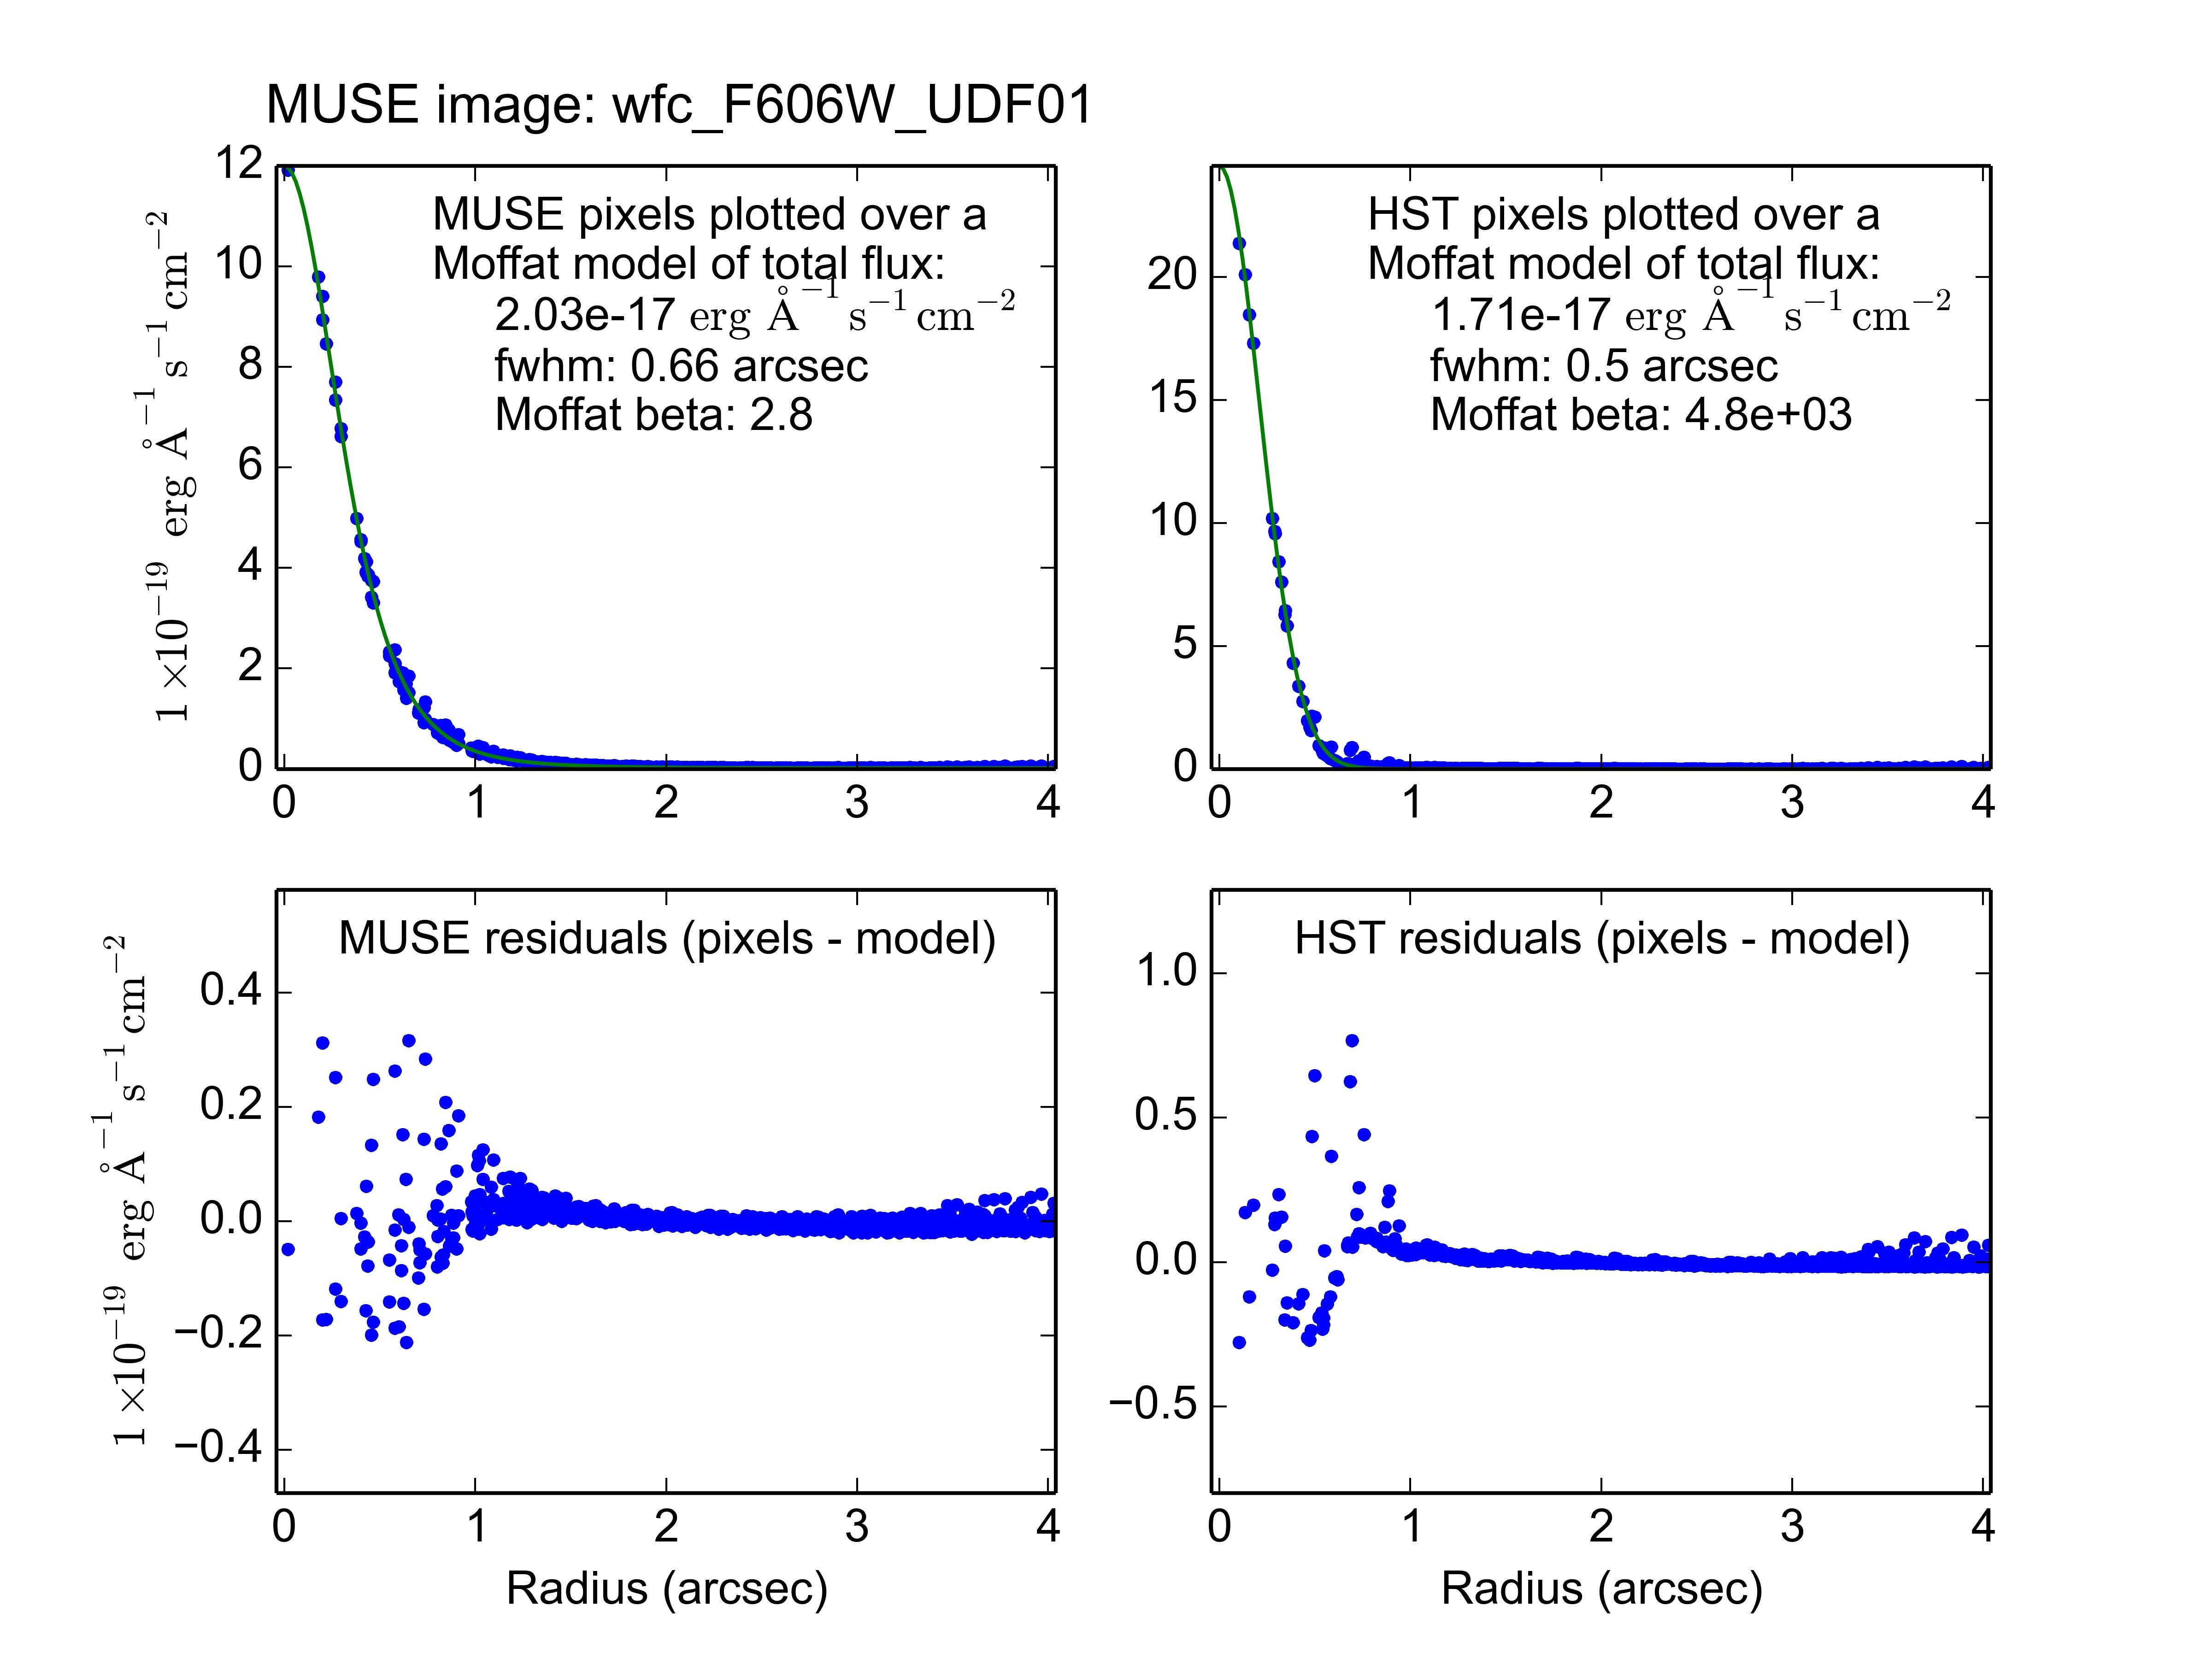
If instead the fit is restricted to the lower of the two star-like sources, which is the brightest object in the image, the image and star-profile fits are as follows:
% fit_photometry hst_F606W_for_UDF01.fits wfc_F606W_UDF01.fits --fix_beta=2.8 --hardcopy jpeg --star 53.157969 -27.769193 4.0
# MUSE observation ID              Method    Flux    FWHM    beta      Flux  x-offset  y-offset
#                                           scale     (")            offset       (")       (")
#--------------------------------- ------  ------  ------  ------  --------  --------  --------
                   wfc_F606W_UDF01  image  1.1267  0.6658  2.8000   0.10463  -0.05662  -0.06206
                   wfc_F606W_UDF01  stars  1.1927  0.6609  2.8000   0.00192  -0.06116  -0.06593
The two sets of fitted parameters are from the image-fitting algorithm and the star-profile fitting algorithms, respectively, as are the following plots. The fitted FWHM is similar to what was fitted before, but the flux scale factor is significantly larger than that of the fit to the none star-like objects, and the fitted position error is very different.
To get some more insight into the discrepancy between the values that were obtained on the stars, compared to those obtained on the dimmer more diffuse sources, the following command was used. This fixes the photometric parameters to have the values that were obtained above, when the stars were excluded, but displays how well these fit the image when the stars are still included:
% fit_photometry hst_F606W_for_UDF01.fits wfc_F606W_UDF01.fits --hardcopy jpeg --fix_scale=0.9484 --fix_fwhm=0.6519 --fix_beta=2.8 --fix_bg=0.05713 --fix_dx=0.01345 --fix_dy=0.00617
# MUSE observation ID              Method    Flux    FWHM    beta      Flux  x-offset  y-offset
#                                           scale     (")            offset       (")       (")
#--------------------------------- ------  ------  ------  ------  --------  --------  --------
                   wfc_F606W_UDF01  image  0.9484  0.6519  2.8000   0.05713   0.01345   0.00617
Since the fixed parameters were previously the best fits to everything except the stars, it is no surprise that the only significant residuals are the two stars. The upper of these two sources is clearly under-subtracted, as though its flux at the time of the MUSE observation, was higher than when the HST observation was made. The residual of the lower of the two sources, however, is white on the lower left, and black on the upper right. This implies that this star moved towards the lower-left between the epochs of the two observations. A search of the literature confirms that the upper source is indeed variable, and the lower source has high proper motion.
More specifically the upper source appears to be an AGN. In [1],
Cohen et. al reported that between 2 of the four HST UDF observing
runs, the flux of this source (UDF 9397) changed by 6%. This is much
less than the 20% discrepancy seen above, between the flux
scale-factor determined on the stars, and the scale factor fitted to
other sources. In practice, as described in the pitfalls
section, the majority of the flux discrepancy is due to point sources
appearing dimmer than they should in HST observations, due to CCD
charge transfer losses.
In [2], Pirzkal et al reported that the lower of the two point sources, (UDF 9230) is a star with a proper motion of about 10 mas/year. Over the roughly 11 years that separate the epoch of the HST and MUSE observations of this field, this corresponds to a distance of about 0.1 arcsec on the sky, which is 3 MUSE pixel widths. This turned out to be a good estimate. The vector difference between the fitted pointing corrections that were obtained above when the star was included, and when it was not included, the star appears to have moved by 0.098 arcseconds.
In conclusion, to fit for the flux scale of MUSE images of the UDF01 field, it is best to perform the fit to the whole image, after masking out the two point sources using a region file. The pointing error and PSF parameters of the field can also be obtained from this fit, but lower noise estimates of these parameters may be obtained by fitting a Moffat profile to the QSO in UDF01.
FWHM versus wavelength
The examples of the previous section operated on images that had the spectral response curve of the HST F606W filter. If similar fits are also performed to MUSE images that have the spectral response curves of other HST filters, then the variation of the fitted FWHM of the PSF can be obtained versus wavelength. In the following diagram, the best-fit values of the PSF FWHM are plotted versus the pivot wavelength of these filters. The results of 3 different sets of fits are plotted. The first fit was to everything in the images of UDF01 except for the star and the QSO, which were excluded with a region file. The second fit was limited to a region of 3 arcseconds radius, centered on the QSO. The final fit was similarly limited to a circle centered on the star in UDF01.
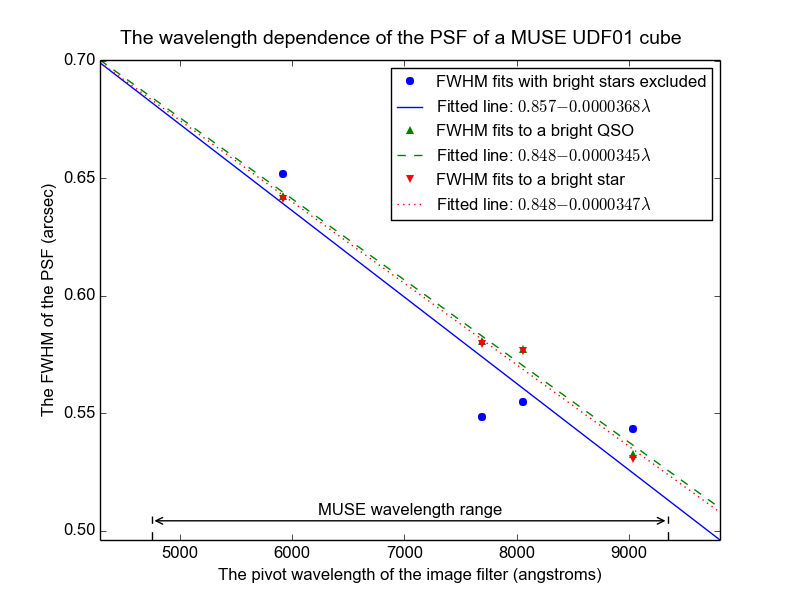
The FWHMs that were fitted to the star and the QSO are so similar that their plotted values overlap. Together they trace out a straight line versus wavelength. The FWHMs fitted to the rest of the image are similar, but clearly less well constrained. This may be due to a lack of bright sources, once the star and QSO had been excluded.
Footnotes